Troubleshooting Bravura Security Fabric server failures
This section describes ways to diagnose and recover from faults that may occur on a Bravura Security Fabric server.
Replication errors in log files
The following log file messages appearing in the idmsuite.log file indicate replication problems:
Log message | Explanation |
|---|---|
Failed to insert data block into receive queue | Likely means that the local queue — which holds transactions that will be committed to the local database — is either corrupt or full. |
Failed to deserialize record for x | Something in the receive queue could not be parsed. Likely due to disk corruption, queue file corruption or a truncated transmission inbound to the local node. |
Failed to execute replication | Received a transaction from a remote node which should be committed to the local database and failed to execute the relevant stored procedure on the local database. See the remainder of the message for details about which procedure was called and with what arguments. Please refer to the failed procedures log for the data that could not be posted locally. |
Retried proc x times. Aborting. | Unknown (database-related) errors encountered while running stored procedure on the local database. Review contents of the failed procedures log to see what procedure was attempted. |
Failed to initialize the send queue for node. | Something is wrong with the setup of a new queue file which will hold transactions pending transmission to a remote node. The queue file may be corrupted or the disk full. |
Stopping replication to... x, as it is sharing schema with this site. | The local database has a unique schema ID. The remote database also has a unique schema ID. Replication has been configured between the two nodes, but the replication services on the two communication endpoints noticed that the two schema IDs are the same. This implies that the two databases are one and the same (a shared schema) so replication should not be performed. |
Databases contain unsynchronized data
Generally, during replication:
A stored procedure runs on server A.
Server A puts that stored procedure into its queue.
When it is able to talk to server B, it will attempt to transmit the contents of the queue to server B.
If server B verifies that the transmission occurred correctly, server B inserts the data into its receive queue.
Server B then responds to server A stating that it received the data correctly.
Server A then removes the data from its queue.
Server B in the meantime starts processing the data in its receive queue.
Problems can occur when:
The queue is deleted or corrupted.
A server is taken out of replication for a while and as a result, updates to it are not queued.
Something goes wrong and the stored procedure is not executed properly on the secondary server. In this case the problem may fix itself the next time the data is updated.
The \<instance>\db\ directory contains two files that can be used to investigate why certain nodes do not have the same set of data as other nodes.
The file iddb-failed-procs-receivequeue.log keeps track of all failed replication procedures that were successfully received from the sending node, but were not processed on the local instance. These include, but are not limited to, procedure errors such as:
Invalid key constraints.
Accessing nonexistent records.
Full databases.
The files iddb-failed-procs-<node ID>.log are used to track replication procedures that failed on the sender side, mainly because the procedures were not added to the queue to be sent to the receiving server. These kinds of errors include, but are not limited to:
Corrupt queue files.
Corrupt header files.
You can use these files to identify the procedure causing a problem, then determine how to correct it, either by adding or correcting the failed record, or by replaying the stored procedure. The appropriate values needed for the failed stored procedure can be found in the iddb-failed-procs-* files.
The following is an example of the contents of these files:
  2011-07-06\
    22:21:52,\
    PslStoreAdd,\
    "namespace" "key" "S" "value" "4e14e000",\
    constraint violation
The format of this file is:
Date.
Time.
Procedure name.
Arguments to the procedure.
Database error message.
These logs are not automatically scrubbed, so they could grow without bound if the database experiences many problems.
Observed replication queue increases
If you notice that some configuration or data is different between replicated nodes, investigate each node to identify potential problems.
Click Manage the system > Maintenance > Database replication, then click each node, even those with green checkmarks.
The checkmark at the end of each row becomes a red "x" if the database service (iddb) detects an issue when contacting or communicating with the other node's iddb . Hover over the x to see a quick message about the status of that communication.
Hover over the clock icon at the beginning of each row to check whether the server clocks between the two servers differ by more than 60 seconds, at which point the database services stop sending messages to each other, causing the replication queues to increase.
Click each node to observe its runtime details and configuration options on a separate tab. The sections in each node's Details page are important, and each section describes the communication in one direction (send or receive) with a different node. Each node has a different Send queue and Receive queue for each other node in the instance.
The important values to check are described below:
Backlog size
The Backlog size value is a measure of the replication data that is pending and waiting to be synchronized across the nodes.
As long as there is data in the replication backlogs, the nodes show different data in their web UI as a temporary synchronization issue.
If stored procedures (sprocs) fail to be applied on some nodes while they succeed on others, the sync issue becomes more permanent.
Some sprocs that fail once may succeed later if the issue that caused the original failure is resolved. For example, when a WstnPwdCheckOut fails with "stored procedure exception" = "No lock to check out password", and a user performs a successful check-in on the affected account on the node where that sproc failed, the next WstnPwdCheckOut on the same account will succeed on that node as well.
Queue delay
Queue delay represents the time difference between when a replication event is generated on the source node and when it is actually processed on the destination node. This delay can indicate communication issues between nodes, such as network latency or problems with the database server that may be slowing down the replication process. For example, if it grows, the iddb on the observed node is having trouble communicating with the node listed on the page with the increased delay.
Queue size
The Queue size refers to the amount of data waiting to be replicated from one node to another within the system. It is a measure of the replication data that has been generated but not yet processed or sent to the destination node. A consistently large or growing queue size may indicate issues with network connectivity, database performance, sproc issues, or other system bottlenecks that could affect the efficiency of data replication.
Send queues grow when the iddb service on the observed node has trouble connecting to the iddb of the node in the title of the specific page section.
Possible connection issues include network latency, a slow-running iddb on the sending or receiving end, or handle or socket exhaustion on the sending or receiving node.
In rare cases:
The receiving node cannot write to its incoming queues. To check for this, run this filter on the receiving node's current log file and receive a non-zero result:
grep -c "queue: file size .0. smaller that minimum size" idmsuite.log
The receiving node is out of non-pooling RAM:
grep -c "create accept thread" idmsuite.log
A non-zero result, especially if the tail of those results is recent, means
iddbcannot create receive threads.
Receive queues grow when there is a problem on the backend database of the receiving node.
All receive queues tend to grow at once, with similar values, if all the nodes are under load.
Possible database issues include:
Lack of connectivity from a node to its database.
Network communication delay.
Resource exhaustion issues on the database server.
Locked tables, either from database maintenance or because other sprocs are updating the tables at the time.
A subset of the latter are blocked sprocs, which either process too slowly or are waiting for themselves or other sprocs to finish, or are using obsolete execution plans, calculated by the database engine before the data they apply to was modified by another sproc — including those triggered by database maintenance tasks.
Time since last sproc ran
If this value increases, a sproc is likely taking a long time to run on that database.
As of Bravura Security Fabric version 12.5.0 the iddb service saves a "snapshot" of what can be seen in the Database replication details pages per node, in telemetry (*.rst) files located in the instance's db\ directory, with one record every 30 seconds.
Those files can be parsed in many ways for the rich data present in them. For example to get a trace of replication delays in seconds, you could use the command:
grep "2024-0[67]" telemetry-recv-bravura1.local_hipam.rst | awk -F'|' '{print $1,",",$5}'|sed s/ie=//|sed s/qd=//>times-FTC706.csvIn the above command:
The first grep collects the entries from months 6 and 7 of 2024.
Those entries are piped into awk, which preserves two columns: the timestamp and qd (queue delay).
The next two sed pipes strip the "metadata".
The resulting entries are placed in a CSV file.
You can then use a spreadsheet program to render a chart from the two data columns, like this:
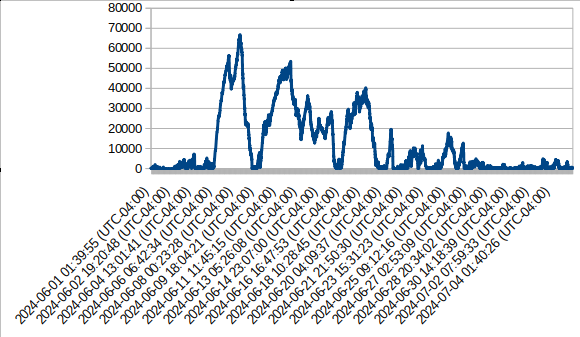
These are the counts of entries with a worst-sproc duration of six or more digits in milliseconds (matching [0-9]{6,}), for those two months. These counts are not complete, unlike those collected from stored-procedure performance entries in idmsuite.log, because thousands of sprocs can run in 30 seconds and only one or two are recorded in these telemetry files:
egrep -c "2024-0[67].*wpt=[0-9]{6,}" telemetry-recv-PTC-bravura1.local_hipam.rst
4534
... and itemized by counts of sprocs:
egrep "2024-0[67].*wpt=[0-9]{6,}" telemetry-recv-bravura1.local_hipam.rst|egrep -o
      "wp=[^|]+"|sort|uniq -c|sort -k1,1nr

3491 wp=PolicyRuleComputerPrepare
388 wp=ManageRuleComputerPrepare
335 wp=WstnPwdReset
264 wp=WstnPwdUpdateStatus
34 wp=DashWorkStatsCompute
13 wp=WstnPwdQueueRandomize
5 wp=WstnPwdResetFail
3 wp=LoaddbInit
These are the fields present in each entry of the telemetry files:
interval_end = "ie"; timestamp for the end of the 30-second interval whose stats are captured in this line.
dataflow_in = "di"; bytes added to the queue in this interval.
dataflow_out = "do"; bytes removed from the queue in this interval.
queue_size = "qs"; size of the queue in bytes at the end of the interval.
queue_delay = "qd"; queue delay in seconds at the end of the interval.
current_item = "ci"; on receive queues, whatever stored proc was running at the end of the interval.
worst_proc = "wp"; on receive queues, the slowest proc that ran during this interval.
worst_proc_time = "wpt"; on receive queues, the duration in milliseconds of the slowest proc that ran during this interval.
Resolution procedure
If the above is happening:
Bravura Security recommends disabling the psupdate process and other automation that would increase the replication queue.
Until you identify the sproc and, if needed, stop its process or restart the affected database.
If the values are decreasing, the situation is likely fine, and the email notifications stop as soon as the replication queues drop below the configured thresholds.
If the values in the web UI are decreasing, it means that the queues grew while database administrators (or automation) were performing maintenance on the servers, and now they are flushing.
Over-large replication queue disk usage
When multiple Bravura Security Fabric nodes are connected in replication and one or more nodes have suffered from a prolonged outage, it is possible for a non-outage node to be using a much larger than normal replication queue, even after the outage itself is resolved. This creates a risk for the outage to spread to otherwise unaffected nodes, if the queues grow too large and free disk space becomes too scarce.
After recovering from a prolonged outage involving other nodes in replication, non-outage nodes may show higher than normal disk space usage. If left unchecked, this may eventually lead to a message in idmsuite.log , like: “Commits to the database have been suspended”, indicating that the node refuses to allow any more operations until more disk space is made available.
To resolve this problem:
Check for large queues and available space on all replicated nodes.
Increase the space available.
Optionally remove unused replication queue data.
If increasing the space is not possible, adjust the replication space settings .
After completing these steps, replication should proceed with free space on disk above the configured threshold.
Verify queues and their settings
Navigate to Manage the system > Maintenance > Database replication.
Select a node showing high disk space usage.
Under the node’s Status tab, inspect each queue for the size of its Allocated space in the queue (bytes) entry relative to its Queue usage warning threshold (%) entry.
If any queue’s allocated size exceeds its threshold size, that queue has become over-large.
Verify the number of files in the instance's db\replication\ directory, and their timestamps.
If there are too many files, Windows File Explorer may crash, or not update correctly, in which case you can use another tool like robocopy.
Increasing space
If possible, Bravura Security Fabric should be installed onto its own, dedicated drive.
To maximize available free disk space, limit or remove unnecessary files on the Bravura Security Fabric instance’s installation drive.
Provide more space or remove unneeded files.
If an outage is prolonged, Bravura Security Fabric administrators should monitor more closely than usual the disk space usage on the partitions where the Bravura Security Fabric application is installed and replication queue sizes on all non-outage nodes.
If it appears that disk space will become an issue on those other nodes due to queue growth, either add additional disk space to the active nodes where the queues keep growing, or remove the unavailable (outage) nodes from replication, and then restore them manually once those other nodes are recovered.
Remove unneeded/leftover replication queue files.
If a node’s queue files are still large after an outage for other nodes is resolved, perform a manual cleanup of the queue files as follows:
Check the timestamps of the files in the instance's db\replication directory
If they are old - from before the start time of the
iddbservice on that node - they probably can be deleted. First check if they are in use byiddbitself or some other binary.Use sysinternals' process explorer or any other tool that allows you to check for file handles per process.
Check if the running
iddbprocess for the current instance has file handles on all the files in db\replication.If it doesn't, delete the files not being used by
iddb.
(Optionally) Re-check that queue files allocation is now less than the configured threshold.
To prevent the instance from running out of disk space in the first place, ensure that e-mail notifications are working, and that a suitable e-mail address or addresses is configured RECIPIENT EMAIL variable, under Manage the system > Workflow > E-mail configuration.
Root cause
During an outage limited to one node, non-outage nodes will queue database updates to disk until contact is re-established with the outage nodes. If the outage is prolonged, those queues will eventually start to grow. With enough time, disk space will remain depleted until the free-space threshold is reached. At that point, the node will enter DB COMMIT SUSPEND mode (to safeguard against data loss), making the node unusable until the issue is addressed. This is normal, documented behavior.
When the iddb service is stopped unexpectedly (it crashes or the server it runs on loses power) some of the old queues may remain in place and take space without them being used.
Other factors that can exhaust disk space
Replication queue growth is one cause of disk space exhaustion. Several other factors can also consume free disk space on a server where Bravura Security Fabric is installed, particularly when the backend database is on the same server as the application:
SQL transaction log growth: On very busy servers, SQL transaction logs can grow to gigabytes, even when the databases themselves are only hundreds of kilobytes. This can create large db-wal files that consume significant disk space.
Resource starvation: When the database and application compete for resources on the same server, the tempdb database can run out of space, and disk I/O and network connections can slow down.
Historical data accumulation: As Bravura Security Fabric gathers historical data, the backend database grows and needs more disk space over time. Avoid installing the database files on the same drive as Bravura Security Fabric. As a best practice, separate the data file from the log file, and install the database log file on a dedicated disk, not a disk partition.
Under-provisioning: If servers do not have the recommended disk space, replication can stop for lack of space for the queue files. Provision more space, or remove unnecessary files and uninstall unnecessary programs that store files on the same drive as Bravura Security Fabric.
Antivirus or other security software: Antivirus programs can lock files and consume I/O. Consider excluding the processes that run from within the Bravura Security Fabric instance folder.
Virtual memory paging: Too little RAM on a virtual machine leads to paging, which is slower and can use significant disk space. Add sufficient RAM, and limit the growth of the page file.
Stray files: Old replication queue files, old logs, improperly stored backups, and unnecessary applications on the instance drive all consume space. Perform regular maintenance and cleanup.
Logging misconfiguration: Poorly managed logging can accumulate files and use up disk space. Store application log files on a different disk from the application, use full debugging only when required, and enable log file rotation and confirm that it works.
Missing iddb queue files
If one or more queue files are not properly generated, then a failure may occur once the queue is full and begins searching for the missing files. Files may be missing as a result of being deleted, or if the hard drive is full and new files cannot be written.
The missing file failure causes the failed-retry value to begin counting as it attempts to find the missing queue files. Once the counter reaches the failed-retry value it triggers the DB COMMIT SUSPEND state.
To recover from this suspension, restart the iddb service. This regenerates all missing queue files.
Caution
Any data that was waiting in the queue will not be replicated. A database administrator must manually consolidate each node’s database.
Missing psupdate replication batch files
If one or more psupdate replication batch files are not properly generated during the psupdate process, then a replication failure can occur. Files may be missing as a result of being deleted, or if the hard drive is full and new files cannot be written.
The missing file failure causes replication to fail and possibly suspend the database.
To recover from this suspension:
Stop the
iddbservice.Delete all replication batch files, located in:
<Program Files path>\Bravura Security\Bravura Security Fabric\<instance>\db\replication\
Replication batch files follow this naming scheme: <guid>_<node ID>
Do not delete files that do not follow this naming scheme.
The replication folder is only created when replication files are created.
Caution
Any data that was waiting in the queue will not be replicated. A database administrator must manually consolidate each node’s database.
Start the
iddbservice.Re-run
psupdate. You may need to re-list users on targets.
Unreadable passwords
When you try to view the password for a managed system and the password does not appear as plain text, it is possible that replicated servers are out of sync. You can check and resynchronize passwords by navigating to Manage the system > Privileged access > Managed system policies.
Server clocks unsynchronized
Server clocks on replication nodes must be synchronized. Clock times should not differ by more than 60 seconds. Use the page to view the status of the replication nodes (Manage the system > Maintenance > Database replication).
If the server clocks of the replication nodes start to drift out of synchronization by too many seconds, the time status on the Database replication page displays this issue. You can then view the status of each node, note the time difference, and see if the server can be contacted.
You must update the time settings manually to resynchronize server clocks.